Overview
The Service Analytics Dashboard provides actionable information for your Service Tickets, Appointments, and Reminders. This article explains how to access and use the dashboard to track technician productivity, review scheduled services, monitor dispatch handling, and analyze service performance over custom date ranges.
This feature is available to supervisors, dispatchers, and management — but must be enabled for your user ID before you can access it. See the Enabling the Feature section below.
Who Benefits from This Feature
| Role | How It Helps |
|---|---|
| Supervisors | Quickly see an overview of how dispatches are being handled, monitor team productivity and performance, and identify bottlenecks in service delivery. |
| Dispatchers | Review their own activity to ensure they are on task, track ticket status and completion, and manage workload distribution. |
| Management | Analyze service department performance, make data-driven decisions about staffing and scheduling, and identify trends and areas for improvement. |
Enabling the Feature
This feature must be enabled for your user ID before you can access it. Follow the steps below to request access.
- Contact your system administrator. Let them know you need the Service Analytics Dashboard enabled for your user ID.
- Administrator submits the request. Your administrator should contact Cornerstone Customer Success to request that the feature be enabled for your user ID.
- Contact Customer Success directly if needed — by email at customer.success@alarmbills.com or by phone at 847-405-9517.
⚠️ IMPORTANT
This feature must be enabled for your specific user ID before the Analytics button will be accessible. If you do not see the Analytics button in the locations described below, your user ID has not yet been enabled — contact your administrator or Cornerstone Customer Success to request access.
How to Access the Service Analytics Dashboard
The dashboard can be accessed from two locations within Cornerstone.
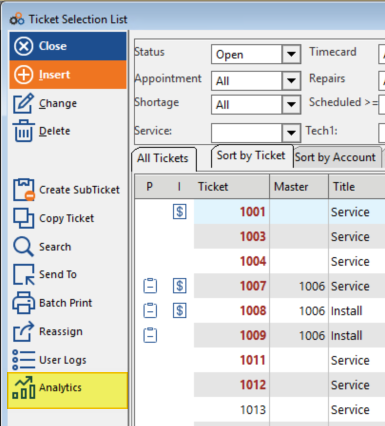
Method 1 — Via the Ticket Selection List
- Click Tickets on the menu bar.
- Click Analytics from the Ticket Selection List.
- The Service Analytics Dashboard opens.
Step 1 — Click Tickets on the menu bar:

Step 2 — Click Analytics in the Ticket Selection List:
Method 2 — Via the Calendar of Appointments
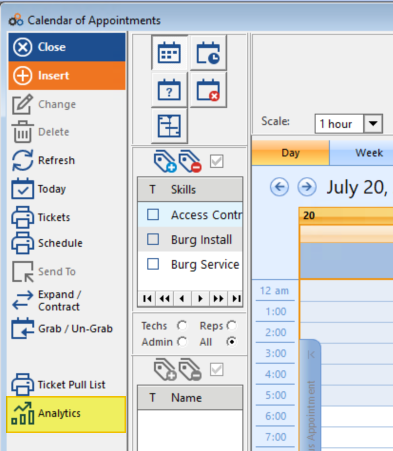
- Click Calendar on the menu bar.
- Click Analytics from the Calendar of Appointments.
- The Service Analytics Dashboard opens.
Step 1 — Click Calendar on the menu bar:

Step 2 — Click Analytics in the Calendar of Appointments:
The Service Analytics Dashboard — Default Settings
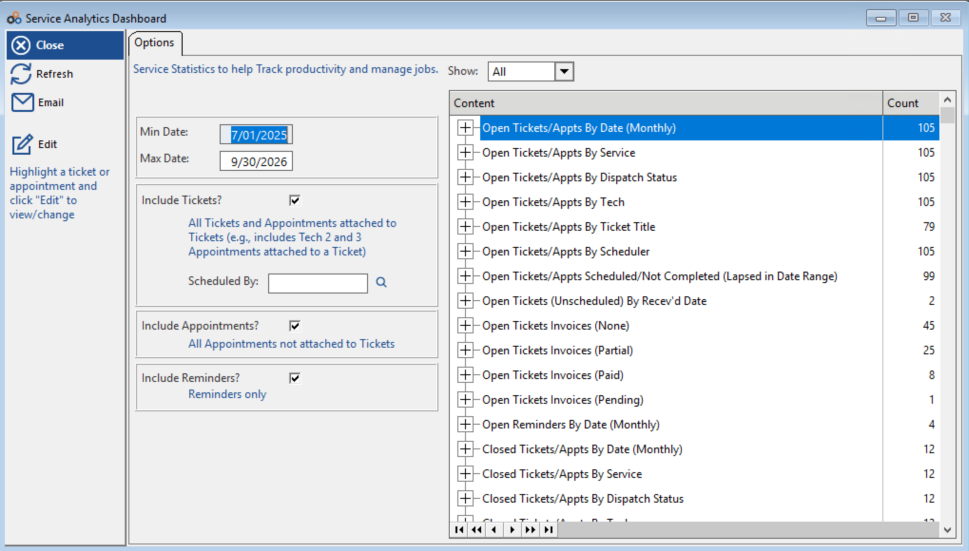
When the dashboard opens, it will load with the following defaults already set:
- Show: All tickets — both Open and Closed.
- Min Date / Max Date: A 3-month range, starting with the current month.
- Include Appointments: Checkbox enabled.
- Include Reminders: Checkbox enabled.
The Service Analytics Dashboard showing default options and the full content list with counts:
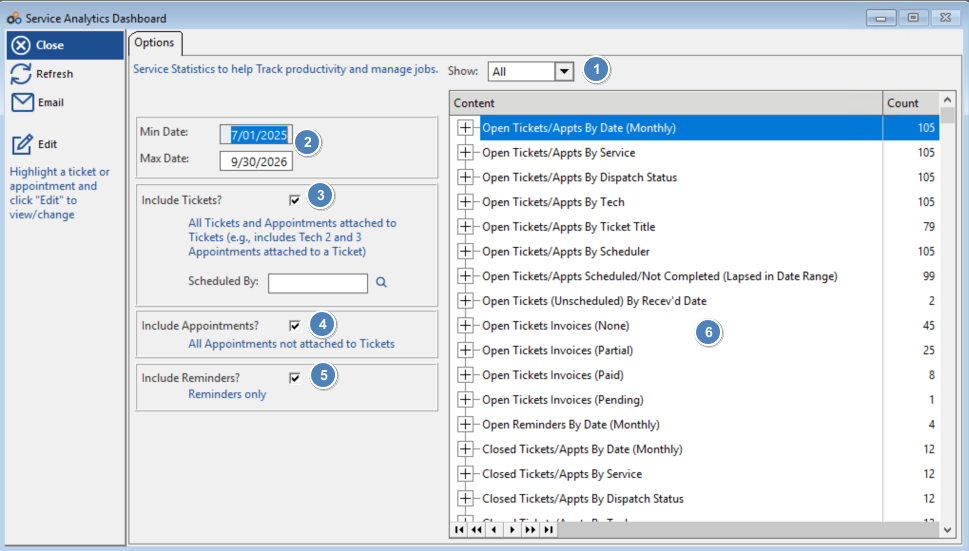
The numbered callouts in the annotated dashboard view below correspond to the key controls:
| Callout | Control | Description |
|---|---|---|
| 1 | Show | Filter to display All, Open, or Closed tickets. |
| 2 | Min Date / Max Date | Set the date range for the data. Defaults to a 3-month window starting with the current month. |
| 3 | Include Tickets? | Includes all tickets and appointments attached to tickets (e.g., Tech 2 and 3 appointments attached to a ticket). Use the Scheduled By field to filter by a specific scheduler. |
| 4 | Include Appointments? | Includes all appointments not attached to tickets. |
| 5 | Include Reminders? | Includes reminders only. |
| 6 | Content List | The right panel displays all content categories with their counts. Click the + sign next to any category to expand and drill down. |
How to Examine a Ticket
The dashboard uses a drill-down structure, starting from high-level category summaries and allowing you to navigate down to individual ticket details.
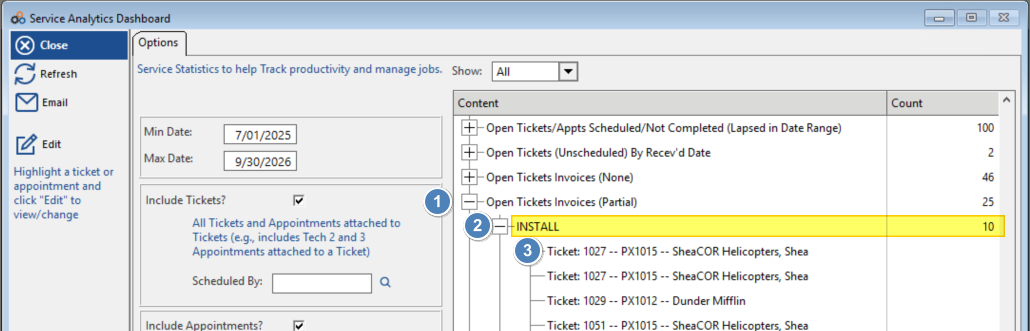
- Click the + sign next to a category in the Content list to expand it.
- Click the + sign next to any subsection to see detailed results within that category.
- Double-left-click a ticket to open the full ticket, reminder, or appointment record.
Example — expanding "Open Tickets Invoices (Partial)" reveals a subsection (INSTALL) and individual tickets beneath it:
⚠️ IMPORTANT
To open and view or change a ticket, appointment, or reminder from within the dashboard: highlight the item and click Edit in the left-hand panel. The left panel also notes: "Highlight a ticket or appointment and click 'Edit' to view/change."
Key Features
Drill-Down Analysis
Start with a high-level category view, then drill down to individual ticket details to analyze specific service patterns.
Time Period Analysis
Review performance over custom date ranges. Track trends over weeks, months, or quarters, and compare periods to identify improvements.
Technician Performance
View tickets completed by specific technicians, track individual productivity metrics, and identify top performers and training opportunities.
Service Completion Tracking
Identify scheduled tickets that were never completed, monitor average time from request to completion, and track service level compliance.
Key Questions the Dashboard Answers
- Which tickets were scheduled but never completed?
- How many days did it take from service request to completion?
- How many tickets did a specific technician complete during a time period?
Common Use Cases
| Use Case | How to Use the Dashboard |
|---|---|
| Productivity Tracking | Monitor how many tickets each technician completes over time to identify productivity trends and set realistic goals. |
| Service Level Monitoring | Track the time from service request to completion to ensure you're meeting customer expectations and service level agreements. |
| Incomplete Work Management | Identify scheduled tickets that were never completed to follow up and prevent customer dissatisfaction. |
| Performance Reviews | Use historical data to conduct fair and data-driven technician performance reviews. |
| Capacity Planning | Analyze ticket volume and completion rates to determine if additional staff or resources are needed. |
Getting Started
- Request Access. Contact your administrator to request feature enablement.
- Get Enabled. Your administrator contacts Cornerstone Customer Success to enable the feature for your user ID.
- Access the Dashboard. Once enabled, click Analytics from the Ticket Selection List or the Calendar of Appointments.
- Explore Data. Start with the overview and drill down into specific categories using the + signs.
- Set Benchmarks. Use initial data to establish performance baselines.
- Regular Review. Schedule regular review sessions to monitor trends over time.
Tips for Maximum Value
- Review the dashboard weekly to stay on top of service performance.
- Use the drill-down features to investigate outliers or unusual patterns.
- Compare technician performance to identify best practices.
- Share insights with your team to drive improvement.
- Set goals based on dashboard metrics and track progress over time.
Need Additional Help?
Our Customer Success team is here to assist you.
Phone: 847-405-9517
Email: customer.success@alarmbills.com
Copyright © 1999–2026 Cornerstone Billing Solutions. All rights reserved.
Was this article helpful?
That’s Great!
Thank you for your feedback
Sorry! We couldn't be helpful
Thank you for your feedback
Feedback sent
We appreciate your effort and will try to fix the article